
Article originally appeared in the March/April 2019 Edition of NEFA Newsline.
Imagine you’re a politician in a large town where people are getting sick and dying at a startling rate. You and your colleagues are at a loss for what to do. You don’t know how the disease is spreading or where to quarantine the threat. You and your people are scared, and you’re woefully unprepared to handle and manage the threat.
During an emergency gathering, a man approaches, confident that he knows how this disaster is spreading. Rightfully, you and your colleagues are skeptical. The best minds of the community have failed to come up with any viable solutions, and suddenly this man is telling you with confidence how the disease is moving. You could trust him, but keep in mind the gravity of your decision. If you’re wrong, people die. A hunch is not good enough, you need facts.
This scenario is a probably a little melodramatic, but the core elements translate well to a discussion on using data analytics in the equipment finance industry. Maybe your decisions won’t directly result in life or death for the people who work with you. But make no mistake, the long-term viability of brokers and lenders, big and small, depends on leaders determining how they apply data narratives.
Back to the outbreak, the man who approached that council brought data to prove his point. The man was named John Snow, the year was 1854, the disease was Cholera, and this is an early example of data analytics being visualized to triangulate a point of origination and predict how it would spread. Snow put together a map of deaths related to Cholera, and then added the locations of local utilities and points of interest. The map showed a high concentration of incidents occurred around a specific water pump. When officials removed the pump handle, the outbreak was halted. People were still affected, but thanks to Snow’s map, officials could predict which homes were more likely to have been affected and could take steps to prevent spreading to other water pumps. An extremely complicated problem with a million variables was solved with a couple of hours and a pipe wrench. The concept of having a complex challenge with a simple solution speaks to the power of predictive analytics and its value to equipment finance organizations.
The finance world at large is notoriously slow to adopt technologies. Software that excels at collecting a wide variety of data and features tools that break down and reshape numerous streams of information, are too rarely found in even the most well-known of equipment finance companies. However, it is also not unreasonable to say that those companies that ignore the tools and data available to them will slowly cease to grow and, eventually, fade away. The truth is this: Companies that do not invest their time, talent and treasure to better their collection and interpretation of their data will certainly leave revenue on the table and risk the future of their businesses.
To unpack what is meant by predictive analytics and data storytelling, it would be helpful to review the basics. For example, what is “predictive analytics”? This is defined by the process of extracting data with the expressed goal of exploring and identifying patterns. We can then use these patterns to, as the name suggests, predict what may occur. Viewed individually these data sets may not mean much, like Snow’s plot of water pumps. But add in some human context, and useful trends and patterns emerge. Taken as a whole, “predictive analytics” refers to the specific process of finding these trends as well as the greater goal of determining what these trends can tell us. However, predictive analytics is never the goal. For that, we have to take a step further to put the data into a context we can quickly unpack, and finally figure out what the data story is trying to tell us.
Visualization refers to the process of taking these data sets and putting them into a format that our eyes can translate into useful information. This happens by adding human context. Pie charts, bar graphs, line graphs; anything that will translate. Snow’s map qualifies, as it takes a mundane list of locations and adds a context with which the council was immediately familiar. Anytime data is visualized, the audience must be considered. If Snow would have plugged those points onto a map that didn’t include street names, house numbers, etc., his presentation may have fallen flat. With those landmarks, the council was able to understand what his map was trying to communicate more clearly.
Data storytelling is the collaborative effort of data, visualization and human context for the purposes of, as the name suggests, telling a story. However, these stories are less like novels than they are like choose-your-own-adventure books. Think less “Game of Thrones” and more “Bandersnatch,” if that helps. We are looking for ways to package information in a manner that is live and connected to specific contexts. This allows us as an audience to consume the data, look at it and take it down different paths to see where those paths lead. Analytic data is like an incomplete story that you can actively explore and question to help make new decisions. For Snow, the story was about telling a narrative of how Cholera was reaching the population, thus giving the council a route to making a decision. And the end result of this process is always about making a decision.

John Snow’s Original Data Map (1854) 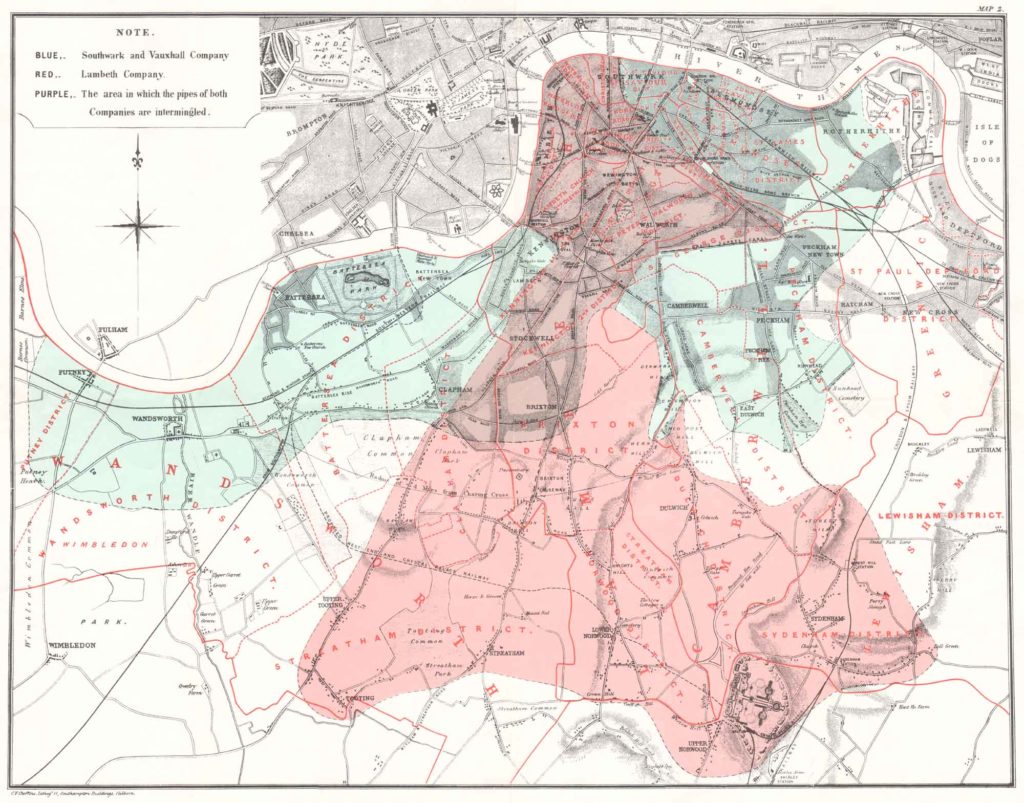
With more data and more visualization, Snow was able to isolate the most heavily impacted areas and prove his hypothesis.
When we discuss software that makes use of predictive analytics, what we’re ultimately looking for are tools to build comprehensive data stories that drive us to positive decisions. If we’re a nationwide funding source, it is not enough to simply know that we make more money in the Southeastern U.S. compared to the Midwestern U.S. We need to know why. Data storytelling bridges the gap between the what and the why in a manner that clicks from a human perspective and shows us a path for improvement.
The reasons why data storytelling is powerful should be immediately obvious from that description, but let’s explore some examples for how that works. After all, the question of what an increased investment in analytics brings depends on how you plan on growing your business. If analytics is a “choose-your-own-adventure” story, then it stands to reason your company will apply this technology differently than another in the same industry.
Using my definition, the most obvious example to explore would be increasing revenue. I already used the concept of breaking down regional income, but the reasons for those differences could be myriad. The distinction is really in the question. The answer to, “Why do we originate more deals?” and “Why do we make more money?” could be very different, so it behooves your team to get to the heart of what you want to accomplish.
If you’re a funding source and your objective is to make more revenue, then you’ll want to isolate data from your most profitable deals and look for a trend. Let’s say that the data shows that you’re getting a great return on truck deals in the Pacific Northwest over the last 24 months. If that’s the case, you can reprioritize to finding more partners in that region for that product, or even incentivizing existing partners to send you more deals. Just like that, you’ve intelligently determined where to spend your resources to increase revenue. The story doesn’t have to be complicated; it just needs to be supported by the data and the story.
Forward-thinking institutions are taking this approach with every element of their business. From revenue forecasting to using analytics models to predict fraud, there are a wide variety of directions that companies can use data that they’re already collecting to making their businesses smarter, more efficient and more profitable. Surely by now, you can see the power of these processes. The question is how do you get started?
First, you must identify what it is that you want to know based on past data, even if you don’t currently have a way to collect it! You could spend your whole life capturing information that ultimately doesn’t move the needle when it comes to answering your questions. Luckily, many of these data points are those that you already look at. Previous fiscal years’ revenue, total number of deals brought in, where end customers are from and commissions paid are all examples of data points you’ll need going forward. The first step is always to know what you want to learn.
The next step is to ask if you have what you need to begin to answer the questions you’ve identified. After all, before you can know what to ask, you have to know what you know. If there are key insights that you’re missing, you can start working backwards to see what data points you’re missing. This will give you a to-do list for when you review data as it becomes available. Don’t worry if you don’t know how best to capture the info, just know what you need to capture.
Finally, you must put in place a set of tools to capture and process your data appropriately. The end game is to select systems to which you have access and can gain the necessary proficiency to appropriately maximize. There is no shortage of options available at all levels of prices. Excel is a great way to lay out your data, but finding and applying formulas can get a tad daunting. Acquiring or reevaluating your Customer Relationship Management (CRM) is probably going to be your first mission here. These systems are most commonly used for tracking sales-related data and dipping one’s toe into the ocean that is process automation, but almost all of the most popular options include at least the most necessarily data capture options and visualization features to get started. Microsoft Dynamics 365 for Sales, despite its verbose name, occupies a unique cross section of affordability and ease-ofuse when it comes to configuring your own field options and dashboards that will visualize and break down information in such a way that the individual can immediately process them. Viewing lots of information with ease is critical to putting your data to work.
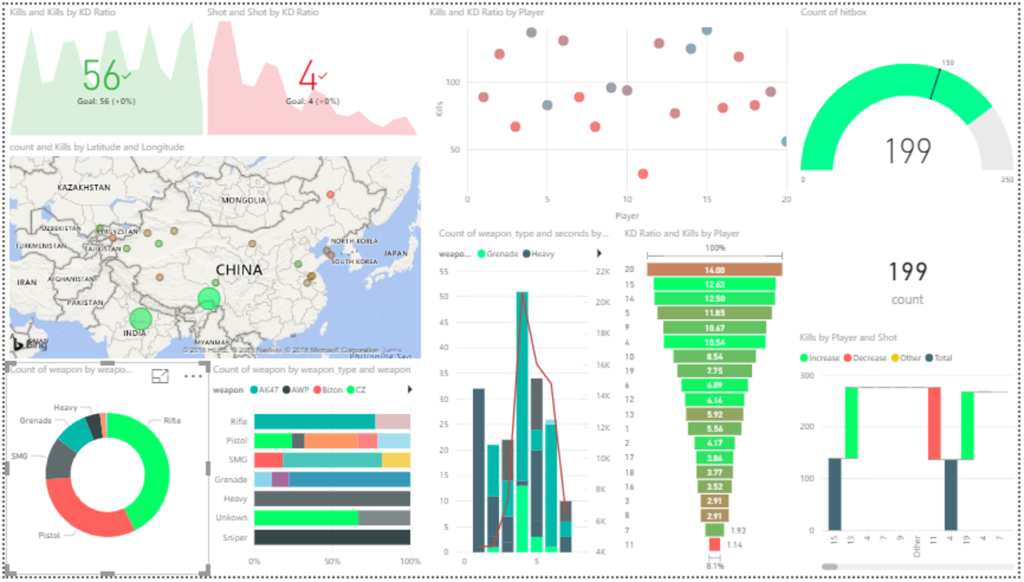
Once you have your data at your disposal, the next step is to explore systems that can import a variety of data sets and handle complex predictive models with ease. Power BI, for example, is Microsoft’s core business intelligence application and one of the best on the market and features a thriving community of professionals and lay users alike. Tableau, Looker and Domo are cloud-based, browser-accessible solutions for teams that have different skill sets. For my money, Power BI is the best when it comes to visualizing data into dashboards that the user can then interact with and drill deeper, thus building that data story (see image above). Best of all, free demos and walkthroughs abound online, and features like plain language questions are becoming more ubiquitous.
Frankly, this conversation is far too broad to totally cover in a couple of thousand words. The ideal next step for any equipment finance organization is to begin to have conversation internally and then bring in external resources. These resources can range from assigning leadership of the project to an individual, who then does a lot of research available online, to bringing in an external contractor or new employee, to purchasing new software to help them accomplish these tasks and provide guidance. Your organization is going to have their own way of going down this path, but I hope I’ve convinced you that this is an initiative that cannot wait. Plus, with all of the tools and tutorials available, there’s no better time than now to put your data to work.
2019-06-03